M5Chart
M5Chart is a versatile charting widget that allows users to create various types of charts, including line charts and bar charts. It provides features for data visualization, customization, and interactivity within the user interface.
UiFlow2 Example
Temperature Line Chart
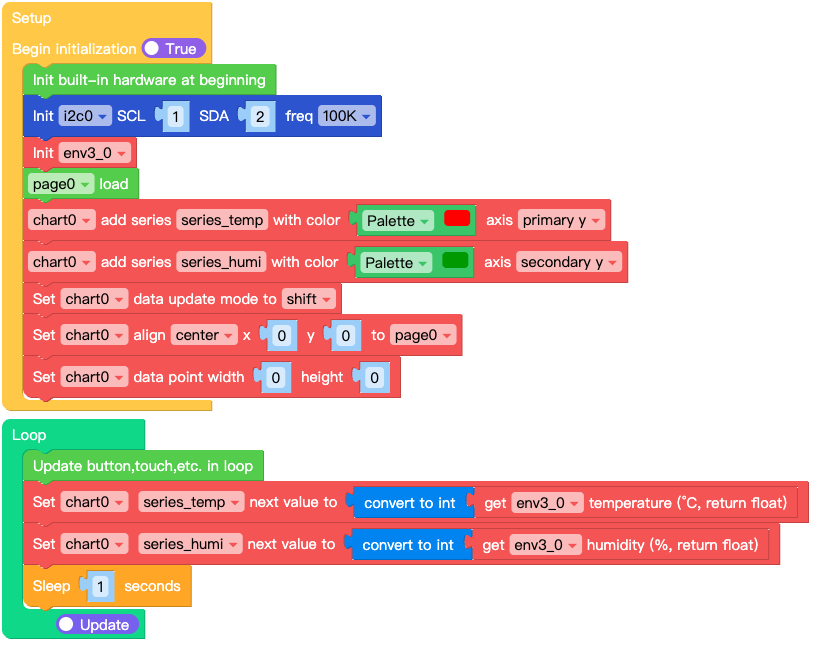
Open the cores3_chart_line_example.m5f2 project in UiFlow2.
This example demonstrates how to create a line chart to visualize temperature data over time.
UiFlow2 Code Block:
Example output:
A line chart displaying temperature data with labeled axes and grid lines.
MicroPython Example
Temperature Line Chart
This example demonstrates how to create a line chart programmatically to visualize temperature data.
MicroPython Code Block:
# SPDX-FileCopyrightText: 2025 M5Stack Technology CO LTD
#
# SPDX-License-Identifier: MIT

import os, sys, io
import M5
from M5 import *
import m5ui
import lvgl as lv
from hardware import Pin
from hardware import I2C
from unit import ENVUnit
import time


page0 = None
chart0 = None
i2c0 = None
series_temp = None
series_humi = None
env3_0 = None


def setup():
    global page0, chart0, i2c0, series_temp, series_humi, env3_0

    M5.begin()
    Widgets.setRotation(1)
    m5ui.init()
    page0 = m5ui.M5Page(bg_c=0xFFFFFF)
    chart0 = m5ui.M5Chart(
        x=43,
        y=40,
        w=240,
        h=160,
        chart_type=lv.chart.TYPE.LINE,
        point_num=10,
        hdiv=3,
        vdiv=5,
        bg_radius=7,
        bg_c=0xFFFFFF,
        border_c=0xE0E0E0,
        border_w=2,
        parent=page0,
    )
    chart0.y_axis1_init(
        min_value=0,
        max_value=50,
        major_ticks=3,
        major_tick_len=10,
        minor_ticks=2,
        minor_tick_len=5,
        label_show=True,
    )
    chart0.y_axis2_init(
        min_value=0,
        max_value=100,
        major_ticks=3,
        major_tick_len=10,
        minor_ticks=2,
        minor_tick_len=5,
        label_show=True,
    )

    i2c0 = I2C(0, scl=Pin(1), sda=Pin(2), freq=100000)
    env3_0 = ENVUnit(i2c=i2c0, type=3)
    page0.screen_load()
    series_temp = chart0.add_series(0xFF0000, lv.chart.AXIS.PRIMARY_Y)
    series_humi = chart0.add_series(0x009900, lv.chart.AXIS.SECONDARY_Y)
    chart0.set_update_mode(lv.chart.UPDATE_MODE.SHIFT)
    chart0.align_to(page0, lv.ALIGN.CENTER, 0, 0)
    chart0.set_style_size(0, 0, lv.PART.INDICATOR | lv.STATE.DEFAULT)


def loop():
    global page0, chart0, i2c0, series_temp, series_humi, env3_0
    M5.update()
    chart0.set_next_value(series_temp, int(env3_0.read_temperature()))
    chart0.set_next_value(series_humi, int(env3_0.read_humidity()))
    time.sleep(1)


if __name__ == "__main__":
    try:
        setup()
        while True:
            loop()
    except (Exception, KeyboardInterrupt) as e:
        try:
            m5ui.deinit()
            from utility import print_error_msg

            print_error_msg(e)
        except ImportError:
            print("please update to latest firmware")
Example output:
A line chart displaying temperature data with labeled axes and grid lines.
API
M5Chart
- class m5ui.chart.M5Chart(*args, **kwargs)
Bases:
chartCreate a Chart object.
- Parameters:
x (int) – X coordinate of the chart’s position. Default is 0.
y (int) – Y coordinate of the chart’s position. Default is 0.
w (int) – Width of the chart. Default is 200.
h (int) – Height of the chart. Default is 100.
chart_type (int) – Type of the chart. lv.chart.TYPE.LINE, lv.chart.TYPE.BAR, etc. Default is lv.chart.TYPE.LINE.
point_num (int) – Number of points in the chart. Default is 10.
hdiv (int) – Number of horizontal division lines. Default is 0 (no lines).
vdiv (int) – Number of vertical division lines. Default is 0 (no lines).
bg_radius (int) – Background corner radius. Default is 7.
bg_c (int) – Background color in hex format. Default is 0xFFFFFF (white).
border_c (int) – Border color in hex format. Default is 0xE0E0E0 (light gray).
border_w (int) – Border width. Default is 2.
parent (lv.obj) – Parent LVGL object. Default is the active screen.
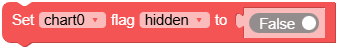
- set_flag(flag, value)
Set a flag on the object. If
valueis True, the flag is added; if False, the flag is removed.- Parameters:
- Returns:
None
UiFlow2 Code Block:
MicroPython Code Block:
chart_0.set_flag(lv.obj.FLAG.HIDDEN, True)
- toggle_flag(flag)
Toggle a flag on the object. If the flag is set, it is removed; if not set, it is added.
- Parameters:
flag (int) – The flag to toggle.
- Returns:
None
UiFlow2 Code Block:

MicroPython Code Block:
chart_0.toggle_flag(lv.obj.FLAG.HIDDEN)
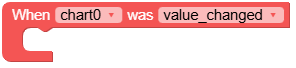
- add_event_cb(handler, event, user_data)
Add an event callback to the chart. The callback will be called when the specified event occurs.
- Parameters:
handler (function) – The callback function to call.
event (int) – The event to listen for.
user_data (Any) – Optional user data to pass to the callback.
- Returns:
None
UiFlow2 Code Block:
MicroPython Code Block:
def chart_0_value_changed_event(event_struct):
    global page0, button0
    print("value changed)

def chart_0_event_handler(event_struct):
    global page0, button0
    event = event_struct.code
    obj = event_struct.get_target_obj()
    if event == lv.EVENT.VALUE_CHANGED:
        chart_0_value_changed_event(event_struct)
    return

chart_0.add_event_cb(chart_0_event_handler, lv.EVENT.ALL, None)
- set_bg_color(color, opa, part)
Set the background color of the chart.
- Parameters:
- Returns:
None
UiFlow2 Code Block:

MicroPython Code Block:
chart_0.set_bg_color(lv.color_hex(0xFFFFFF), 255, lv.PART.MAIN | lv.STATE.DEFAULT)
- set_border_color(color, opa, part)
Set the border color of the chart.
- Parameters:
- Returns:
None
UiFlow2 Code Block:

MicroPython Code Block:
chart_0.set_border_color(lv.color_hex(0x2196F3), 255, lv.PART.MAIN | lv.STATE.DEFAULT)
- set_style_border_width(width, part)
Set the border width of the chart.
- Parameters:
- Returns:
None
UiFlow2 Code Block:

MicroPython Code Block:
chart_0.set_style_border_width(2, lv.PART.MAIN | lv.STATE.DEFAULT)
- set_type(chart_type)
Set the type of the chart.
- Parameters:
chart_type (int) – The type of the chart (e.g., lv.chart.TYPE.LINE, lv.chart.TYPE.BAR).
- Returns:
None
UiFlow2 Code Block:

MicroPython Code Block:
chart_0.set_type(lv.chart.TYPE.LINE)
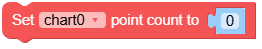
- set_point_count(count)
Set the number of points in the chart.
- Parameters:
count (int) – The number of points.
- Returns:
None
UiFlow2 Code Block:
MicroPython Code Block:
chart_0.set_point_count(10)
- set_update_mode(mode)
Set the update mode of the chart.
- Parameters:
mode (int) – The update mode (e.g., lv.chart.UPDATE_MODE.CIRCULAR, lv.chart.UPDATE_MODE.SHIFT).
- Returns:
None
UiFlow2 Code Block:

MicroPython Code Block:
chart_0.set_update_mode(lv.chart.UPDATE_MODE.CIRCULAR)
- set_div_line_count(hdiv, vdiv)
Set the number of division lines on the chart.
- Parameters:
- Returns:
None
UiFlow2 Code Block:

MicroPython Code Block:
chart_0.set_div_line_count(5, 5)
- get_type()
Get the type of the chart.
- Returns:
The type of the chart.
UiFlow2 Code Block:

MicroPython Code Block:
chart_type = chart_0.get_type()
- get_point_count()
Get the number of points in the chart.
- Returns:
The number of points.
- Return type:
UiFlow2 Code Block:

MicroPython Code Block:
point_count = chart_0.get_point_count()
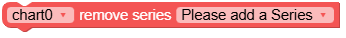
- remove_series(series)
Remove a data series from the chart.
- Parameters:
series (lv.chart.Series) – The data series to remove.
- Returns:
None
UiFlow2 Code Block:
MicroPython Code Block:
chart_0.remove_series(series_0)
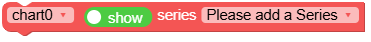
- hide_series(series)
Hide a data series on the chart.
- Parameters:
series (lv.chart.Series) – The data series to hide.
- Returns:
None
UiFlow2 Code Block:
MicroPython Code Block:
chart_0.hide_series(series_0)
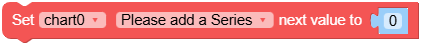
- set_next_value(series, value)
Set the next point’s Y value according to the update mode policy.
- Parameters:
series (lv.chart.Series) – The data series to update.
value (int) – The Y value to set.
- Returns:
None
UiFlow2 Code Block:
MicroPython Code Block:
chart_0.set_next_value(series_0, 50)
- get_pressed_point()
Get the index of the pressed point on the chart.
- Returns:
The index of the pressed point.
- Return type:
UiFlow2 Code Block:

MicroPython Code Block:
pressed_point_index = chart_0.get_pressed_point()
- set_style_radius(radius, part)
Set the corner radius of the chart.
- Parameters:
- Returns:
None
UiFlow2 Code Block:

MicroPython Code Block:
chart_0.set_style_radius(10, lv.PART.INDICATOR | lv.STATE.DEFAULT)
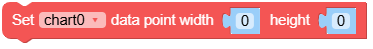
- set_style_size(w, h, part)
Set the size of the chart.
- Parameters:
- Returns:
None
UiFlow2 Code Block:
MicroPython Code Block:
chart_0.set_style_size(0, 0, lv.PART.INDICATOR | lv.STATE.DEFAULT)
- set_pos(x, y)
Set the position of the chart.
- Parameters:
- Returns:
None
UiFlow2 Code Block:
MicroPython Code Block:
chart_0.set_pos(100, 100)
- set_x(x)
Set the x-coordinate of the chart.
- Parameters:
x (int) – The x-coordinate of the chart.
- Returns:
None
UiFlow2 Code Block:
MicroPython Code Block:
chart_0.set_x(100)
- set_y(y)
Set the y-coordinate of the chart.
- Parameters:
y (int) – The y-coordinate of the chart.
- Returns:
None
UiFlow2 Code Block:
MicroPython Code Block:
chart_0.set_y(100)
- align_to(obj, align, x, y)
Align the chart to another object.
- Parameters:
- Returns:
None
UiFlow2 Code Block:
MicroPython Code Block:
chart_0.align_to(page_0, lv.ALIGN.CENTER, 0, 0)
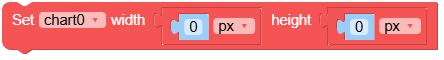
- set_size(width, height)
Set the size of the chart.
- Parameters:
- Returns:
None
UiFlow2 Code Block:
MicroPython Code Block:
chart_0.set_size(200, 30)
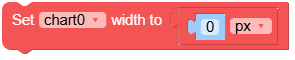
- set_width(width)
Set the width of the chart.
- Parameters:
width (int) – The width of the chart.
- Returns:
None
UiFlow2 Code Block:
MicroPython Code Block:
chart_0.set_width(200)
- get_width()
Get the width of the chart.
- Returns:
The width of the chart.
- Return type:
UiFlow2 Code Block:

MicroPython Code Block:
width = chart_0.get_width()
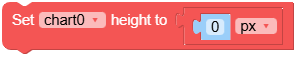
- set_height(height)
Set the height of the chart.
- Parameters:
height (int) – The height of the chart.
- Returns:
None
UiFlow2 Code Block:
MicroPython Code Block:
chart_0.set_height(30)
- get_height()
Get the height of the chart.
- Returns:
The height of the chart.
- Return type:
UiFlow2 Code Block:

MicroPython Code Block:
height = chart_0.get_height()
- x_axis_init(width=lvgl.pct, height=50, mode=lvgl.scale.MODE.HORIZONTAL_BOTTOM, min_value=0, max_value=100, major_ticks=5, major_tick_len=10, minor_ticks=2, minor_tick_len=5, label_show=True)
Initialize the X axis.
- Parameters:
width (int) – Width of the X axis. Default is lv.pct(100).
height (int) – Height of the X axis. Default is 50.
mode (int) – Mode of the X axis. Default is lv.scale.MODE.HORIZONTAL_BOTTOM.
min_value (int) – Minimum value of the X axis. Default is 0.
max_value (int) – Maximum value of the X axis. Default is 100.
major_ticks (int) – Number of major ticks on the X axis. Default is 5.
major_tick_len (int) – Length of major ticks. Default is 10.
minor_ticks (int) – Number of minor ticks between major ticks. Default is 2.
minor_tick_len (int) – Length of minor ticks. Default is 5.
label_show (bool) – Whether to show labels on the X axis. Default is True.
- y_axis1_init(width=50, height=lvgl.pct, mode=lvgl.scale.MODE.VERTICAL_LEFT, min_value=0, max_value=100, major_ticks=5, major_tick_len=10, minor_ticks=2, minor_tick_len=5, label_show=True)
Initialize the primary Y axis.
- Parameters:
width (int) – Width of the Y axis. Default is 50.
height (int) – Height of the Y axis. Default is lv.pct(100).
mode (int) – Mode of the Y axis. Default is lv.scale.MODE.VERTICAL_LEFT.
min_value (int) – Minimum value of the Y axis. Default is 0.
max_value (int) – Maximum value of the Y axis. Default is 100.
major_ticks (int) – Number of major ticks on the Y axis. Default is 5.
major_tick_len (int) – Length of major ticks. Default is 10.
minor_ticks (int) – Number of minor ticks between major ticks. Default is 2.
minor_tick_len (int) – Length of minor ticks. Default is 5.
label_show (bool) – Whether to show labels on the Y axis. Default is True.
- y_axis2_init(width=50, height=lvgl.pct, mode=lvgl.scale.MODE.VERTICAL_RIGHT, min_value=0, max_value=100, major_ticks=5, major_tick_len=10, minor_ticks=2, minor_tick_len=5, label_show=True)
Initialize the secondary Y axis.
- Parameters:
width (int) – Width of the Y axis. Default is 50.
height (int) – Height of the Y axis. Default is lv.pct(100).
mode (int) – Mode of the Y axis. Default is lv.scale.MODE.VERTICAL_RIGHT.
min_value (int) – Minimum value of the Y axis. Default is 0.
max_value (int) – Maximum value of the Y axis. Default is 100.
major_ticks (int) – Number of major ticks on the Y axis. Default is 5.
major_tick_len (int) – Length of major ticks. Default is 10.
minor_ticks (int) – Number of minor ticks between major ticks. Default is 2.
minor_tick_len (int) – Length of minor ticks. Default is 5.
label_show (bool) – Whether to show labels on the Y axis. Default is True
- set_axis_range(axis, min_value, max_value)
Set the range of the specified axis.
- Parameters:
UiFlow2 Code Block:

MicroPython Code Block:
chart_0.set_axis_range(lv.chart.AXIS.PRIMARY_Y, 0, 200)
- add_series(color, axis)
Add a data series to the chart.
- Parameters:
UiFlow2 Code Block:

MicroPython Code Block:
series_0 = chart_0.add_series(0xFF0000, lv.chart.AXIS.PRIMARY_Y)
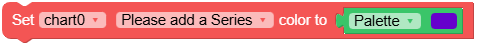
- set_series_color(series, color)
Set the color of a data series.
- Parameters:
series – Series to set the color for.
color (int) – Color of the series in hex format.
UiFlow2 Code Block:
MicroPython Code Block:
chart_0.set_series_color(series_0, 0x00FF00)
- get_series_color(series)
Get the color of a data series.
- Parameters:
series – Series to get the color for.
- Returns:
Color of the series in hex format.
- Return type:
UiFlow2 Code Block:

MicroPython Code Block:
color = chart_0.get_series_color(series_0)
- set_series_values(series, values, size=-1)
Set the values of a data series.
- Parameters:
UiFlow2 Code Block:
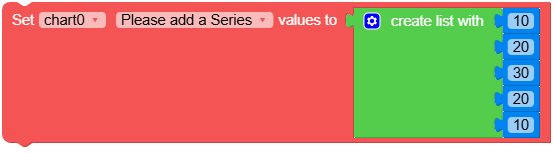
MicroPython Code Block:
chart_0.set_series_values(series_0, [10, 20, 30, 40, 50])